All financial information is presented in US dollars except where otherwise indicated. All operating data is reported using the metric system. Some metrics are reported on both an absolute basis and an intensity basis against kilotonnes of metal processed. Safety data frequency rates are measured per 200,000 hours worked.
Data Measurement Techniques
Data is measured or estimated, and operations are asked to explain significant deviations in year-over-year trends. The performance data is reported at a mix of operational and corporate levels. Data is checked and approved at the site level, and also reviewed for consistency by the corporate data collection team.
We provide safety and environmental incident definitions so that all operations report incidents consistently. We calculate greenhouse gas (GHG) emissions using published factors for emissions.
Most of the performance data for water and energy is metered. We purchase most of our electricity from local grids. Utility grid statistics are therefore used to compile purchased electricity-related GHG numbers. We generate electricity at some of our project sites (such as Constancia and Reed) and this energy is reflected in fuel consumption, while GHG numbers are calculated based on conversion factors.
Data for the indicators is collected and compiled using information submitted by each site on a standard template. We provide instruction and criteria for GRI G4 and Towards Sustainable Mining (TSM), and also supply a GHG emissions worksheet developed by the Mining Association of Canada (MAC).
Key Performance Data
Economic
2016
2015
2014
2013
Direct economic value generated and distributed (in $ millions) (EC1)
Profit (loss) before tax
$5.6
$(331.4)
$13.9
$(53.7)
Revenues
$1,128.7
$923.1
$507.5
$500.9
Operating costs
Canada
358.9
(408.5)
(428.6)
(399.7)
US
0.6
(5.7)
(7.6)
(1.8)
Peru
298.5
(186.0)
(8.7)
(9.7)
Chile
2.2
(0.5)
(1.9)
(2.7)
Colombia
0.0
(0.4)
(0.8)
(3.9)
Total
$660.2
$(601.1)
$(447.6)
$(417.8)
Employee wages and benefits
Canada
147.2
157.1
156.5
160.8
US
0.6
9.3
4.6
1.1
Peru
27.5
22.4
20.6
15.7
Chile
2.2
0.0
0.0
1.2
Colombia
0.0
0.2
0.2
1.2
Total
$177.5
$189.0
$181.9
$179.9
Payments to government
Taxes paid
Canada
6.6
6.1
(21.1)
5.6
US
0.0
0.0
0.1
0.0
Peru
38.9
28.0
5.8
1.5
Chile
0.0
0.0
0.0
0.0
Colombia
0.0
0.0
0.0
0.0
Total
$45.5
$34.1
$(15.2)
$7.1
Municipal taxes and grants
Canada
6.8
6.7
7.8
7.6
US
0.0
0.1
0.5
0.7
Peru
0.0
0.0
0.0
0.0
Chile
0.0
0.0
0.0
0.0
Colombia
0.0
0.0
0.0
0.0
Total
$6.8
$6.8
$8.3
$8.3
Penalties and interest paid
Canada
0.0
0.1
0.0
0.0
US
0.0
0.0
0.3
0.0
Peru
0.3
0.0
0.2
0.0
Chile
0.0
0.0
0.0
0.0
Colombia
0.0
0.0
0.0
0.0
Total
$0.3
$0.1
$0.5
$0.0
Payments to providers of capital
Dividends paid
$3.6
$3.6
$3.8
$18.5
Interest payments made to providers of loans
$126.5
$108.6
$82.1
$56.8
Financing fees paid
Canada11. This increase is mostly the result of a call premium paid to facilitate the early redemption of our senior unsecured notes.
49.4
1.3
0.9
2.8
Peru22. This increase relates to the payments of withholding taxes on loans and other revolver facility fees.
20.1
1.2
4.6
0.0
Total
$69.5
$2.5
$5.5
$2.8
Other interest paid
Canada
0.0
0.0
0.0
0.0
Peru
0.0
0.0
0.0
0.0
Total
$0.0
$0.0
$0.0
$0.0
Capital expenditures – cash flow basis
$192.8
$490.6
$890.9
$878.7
Cash and cash equivalents
$146.9
$53.9
$178.7
$593.7
Payments – Local communities for land use (in $000s)
Canada
0.0
0.0
0.0
0.0
US
0.0
0.0
0.0
0.0
Peru
1,829.3
579.5
1,684.5
10,647.1
Total land use payments
$1,829.3
$579.5
$1,684.5
$10,647.1
Public benefit
Community investment and charitable donations (in $000s)
Canada
345.1
307.1
602.8
650.6
US
147.1
63.5
212.9
48.4
Peru
3,738.3
2,435.7
3,103.0
3,952.0
Chile
0.0
0.0
0.0
0.0
Colombia
0.0
0.0
0.0
0.0
Total community investments and donations33. Political donations are included in this total; however, in accordance with Hudbay policy, political donations were $0.
$4,230.5
$2,806.3
$3,918.7
$4,651.0
Resettlement investment (Peru) (in $000s)
$1,081.5
$957.5
$7,857.0
$16,429.9
Production (contained metal in concentrate)
Copper (000 tonnes)
174.5
147.3
37.6
29.9
Zinc (000 tonnes)
110.6
102.9
82.5
86.5
Gold (000 troy ounces)
114.3
100.2
73.4
79.2
Silver (000 troy ounces)
3,755.9
2,791.5
745.9
772.5
Metal production
Zinc metal (000 tonnes)
102.6
101.9
105.1
96.3
This increase is mostly the result of a call premium paid to facilitate the early redemption of our senior unsecured notes.
This increase relates to the payments of withholding taxes on loans and other revolver facility fees.
Political donations are included in this total; however, in accordance with Hudbay policy, political donations were $0.
Employees
2016
2015
2014
2013
Total workforce (G4-10)
Number of full-time employees
MBU
1,319
1,399
1,391
1,373
Ontario
67
68
61
52
Arizona
40
50
34
N/ap
Peru
230
183
174
157
Colombia
0
0
0
1
Chile
0
0
0
1
Total full-time employees
1,656
1,700
1,668
1,594
Employment11. Includes a union covering 90 employees organized in Peru in October, but negotiations did not begin until 2017.
Number of part-time employees
MBU
10
2
14
N/av – See total below
Ontario
0
0
0
Arizona
2
2
2
Peru
0
0
0
Chile
0
0
0
Total part-time employees
12
4
18
52
Number of contract (term) employees
MBU
13
7
18
N/av – See total below
Ontario
1
5
1
Arizona
0
0
0
Peru
363
187
138
Chile
8
1
0
Total contract employees
385
200
158
23
Number of co-op and summer students hired
MBU
21
40
41
N/av – See total below
Ontario
2
3
2
Arizona
0
2
0
Peru
8
12
6
Chile
0
0
0
Total co-op/summer students
31
57
49
43
Number of employees represented by collective bargaining agreements (G4-11)
1,12111. Includes a union covering 90 employees organized in Peru in October, but negotiations did not begin until 2017.
1,053
1,091
1,047
Percentage of full-time employees represented by trade unions
67.7%
61.9%
65.4%
65.7%
Operational changes (LA4)
Minimum number of weeks provided before operational changes (MBU only)
2
2
2
2
Negotiated into collective agreements (MBU only)
Yes
Yes
Yes
Yes
Number of strikes or lockouts exceeding one week (MM4)
0
1
0
0
Employee turnover (LA1)
Region
MBU
201
206
118
N/av
Corporate
11
5
7
N/av
ABU
16
9
1
N/av
Peru
64
32
53
N/av
Chile
0
0
0
N/av
Total
292
252
179
N/av
Age distribution
<30
20.2%
23.4%
18.4%
N/av
30–50
39.0%
40.5%
50.3%
N/av
>50
40.8%
36.1%
31.8%
N/av
Gender
Male
80.1%
75.4%
82.7%
N/av
Female
19.9%
24.6%
17.9%
N/av
Voluntary turnover rate (Hudbay total)
13.0%
11.4%
7.4%
4.3%
Involuntary turnover rate (Hudbay total)
4.6%
3.6%
3.4%
4.1%
New employee hires
Region
MBU
141
221
155
N/av
Corporate
3
12
7
N/av
ABU
3
23
36
N/av
Peru
280
160
183
N/av
Chile
0
0
0
N/av
Total
427
416
381
N/av
Age distribution
<30
32.8%
40.6%
22.6%
N/av
30–50
54.6%
47.4%
64.0%
N/av
>50
12.6%
12.0%
13.6%
N/av
Gender
Male
83.4%
79.3%
82.9%
N/av
Female
16.6%
20.7%
17.3%
N/av
Net number of full-time employees added (decreased)
Canada
(81)
15
27
79
US
(10)
8
32
0
Peru
47
9
17
26
Colombia
0
0
(1)
(14)
Chile
0
0
(1)
(13)
Total
(44)
32
74
78
Senior management hired from local community (EC6)
9
2
N/av
N/av
Number of contractor full-time equivalent staff (G4-10)
Manitoba
175
274
245
316
Peru
2,974
4,337
9,595
6,438
Arizona
15
55
N/ap
N/ap
Other
13
4
54
25
Person-hours of work (including contractors) (LA1)
North America
3,073,646
3,245,882
3,359,663
3,245,625
South America
7,589,501
9,907,705
20,458,806
13,781,606
Total person-hours
10,663,147
13,158,587
23,818,469
17,027,231
Employees receiving regular performance and career development reviews (LA11)
Percentage reviewed
20%
41%
22%
26%
Hudbay total workforce age distribution (LA12)
<30
14.2%
13.0%
13.8%
11.4%
30–50
53.0%
47.9%
47.8%
47.4%
>50
32.2%
39.6%
36.6%
41.2%
Composition of governance bodies and breakdown of employees
Workforce diversity
Female (Hudbay)
MBU
189
187
182
N/av
Ontario
32
32
27
N/av
Arizona
17
24
15
N/av
New York
0
0
0
N/av
Peru
60
28
35
N/av
Chile
N/ap
N/ap
0
N/av
Percentage of total workforce that is female
18%
16%
16%
17%
Aboriginal (MBU only)
N/av22. This information is not made available until June; therefore, we are a year behind in our public reporting.
13%
12%
13%
Disabled (MBU only)
N/av22. This information is not made available until June; therefore, we are a year behind in our public reporting.
5%
6%
5%
Visible minorities (MBU only)
N/av22. This information is not made available until June; therefore, we are a year behind in our public reporting.
6%
6%
5%
Composition of executive management and corporate governance bodies
Board of Directors (ratio male to female)
4:1
4:1
10:1
9:1
Age distribution
<30
0%
0%
0%
0%
30–50
0%
0%
10%
10%
>50
100%
100%
90%
90%
Executive management (ratio male to female)
5.5:1
5.5:1
10:1
10:1
Age distribution
<30
0%
0%
0%
0%
30–50
53%
64%
72%
64%
>50
46%
36%
27%
36%
Ratio of annual compensation of highest paid individual to mean total compensation (G4-54)
Canada (Manitoba Business Unit, excluding Corporate office)33. Drop in ratio is due to the time period in 2016 when there was no VP of the Manitoba Business Unit.
4.9:1
6.5:1
6.1:1
8.9:1
Canada (including Corporate office)44. Increase in ratio is due to the higher share price and the vesting of bonuses in 2016.
24.1:1
16.4:1
29.8:1
23.5:1
Peru
9.2:1
10.0:1
9.5:1
11.3:1
United States (Arizona Business Unit)
4.3:1
4.2:1
3.1:1
N/av
Workforce represented in formal joint management-worker Health and Safety Committees (LA5)
Percentage represented
100%
100%
100%
100%
Health and safety performance (per 200,000 hours worked, except where noted) (LA6)
Lost time accident frequency (LTA)
Manitoba
1.1
1.0
1.0
0.7
Manitoba contractors
0.0
0.7
0.8
0.3
Peru
0.1
0.7
0.0
0.0
Peru contractors
0.0
0.1
0.0
0.2
Arizona
0.0
0.0
N/ap
N/ap
Arizona contractors
0.0
0.0
N/ap
N/ap
North America (not including MBU and ABU)
0.0
0.0
0.0
0.0
North America contractors (not including MBU and ABU)
0.0
0.0
0.0
0.0
South America (not including Peru)
0.0
0.0
0.0
0.0
South America contractors (not including Peru)
0.0
0.0
0.0
44.1
Total
0.3
0.3
0.1
0.4
Lost time accident severity (SEV)
Manitoba
37.3
35.2
36.0
34.4
Manitoba contractors
0.0
14.8
23.0
0.3
Peru
2.0
22.0
0.0
0.0
Peru contractors
0.6
3.6
0.2
7.1
Arizona
0.0
0.0
N/ap
N/ap
Arizona contractors
0.0
0.0
N/ap
N/ap
North America (not including MBU and ABU)
0.0
0.0
0.0
0.0
North America contractors (not including MBU and ABU)
0.0
0.0
0.0
0.0
South America (not including Peru)
0.0
0.0
0.0
0.0
South America contractors (not including Peru)
0.0
0.0
0.0
163.0
Total
9.3
11.4
4.7
11.0
Restricted work case frequency (RWC)
Manitoba
1.1
1.8
2.2
1.6
Manitoba contractors
0.5
0.0
0.4
0.6
Peru
0.0
0.2
0.0
0.0
Peru contractors
0.0
0.0
0.0
0.4
Arizona
0.0
0.0
N/ap
N/ap
Arizona contractors
0.0
0.0
N/ap
N/ap
North America (not including MBU and ABU)
0.0
0.0
0.0
0.0
North America contractors (not including MBU and ABU)
0.0
0.0
0.0
0.0
South America (not including Peru)
0.0
0.0
0.0
0.0
South America contractors (not including Peru)
0.0
0.0
0.0
0.0
Total
0.3
0.4
0.3
0.6
Medical aid frequency (MA)
Manitoba
11.8
11.0
12.8
12.1
Manitoba contractors
5.5
12.3
12.9
8.8
Peru
0.0
2.3
0.0
0.6
Peru contractors
0.2
0.2
0.5
0.9
Arizona
0.0
4.9
N/ap
N/ap
Arizona contractors
0.0
5.3
N/ap
N/ap
North America (not including MBU and ABU)
0.0
0.0
1.2
0.0
North America contractors (not including MBU and ABU)
0.0
0.0
2.1
0.0
South America (not including Peru)
0.0
0.0
0.0
0.0
South America contractors (not including Peru)
0.0
0.0
0.0
70.5
Total
3.0
3.0
2.1
3.0
First aid frequency (FA)
Manitoba
22.6
22.1
28.5
26.0
Manitoba contractors
4.4
6.0
8.2
3.7
Peru
0.9
4.8
0.4
1.8
Peru contractors
0.4
0.6
1.3
2.4
Arizona
0.0
17.2
N/ap
N/ap
Arizona contractors
0.0
5.3
N/ap
N/ap
North America (not including MBU and ABU)
0.0
0.0
3.7
0.0
North America contractors (not including MBU and ABU)
0.0
0.0
8.3
0.0
South America (not including Peru)
0.0
0.0
0.0
28.1
South America contractors (not including Peru)
0.0
0.0
0.0
136.6
Total
5.7
5.2
4.4
6.2
Fatality (number)
0
0
0
0
Absentee rate (as a % of hours scheduled to be worked)
N/av
N/av
N/av
N/av
Reportable occurrences (defined as EHS incidents required by Hudbay policy to be reported to our Board of Directors)55. In Q4 2016, we adopted revised Board reporting criteria that reduced the number of incidents reported to the Board in order to better focus discussion.
79
141
81
127
Benefits
Corporate
MBU
Full time
Part time
Full time
Life insurance
Yes
No
Yes
Health care
Yes
No
Yes
Disability and invalidity coverage
Yes
No
Yes
Parental leave
Yes
No
Yes
Retirement provision
Yes
No
Yes
Stock ownership
Yes
No
Yes
Other – Critical illness insurance
Yes
No
Management only
Other – Accidental death and dismemberment insurance
Yes
No
Yes
Peru
ABU
Full time
Part time
Full time
Part time
Life insurance
Yes
N/ap
Yes
No
Health care
Yes
N/ap
Yes
No
Disability and invalidity coverage
Yes
N/ap
Yes
No
Parental leave
Yes
N/ap
0
0
Retirement provision
Yes
N/ap
Yes (401k)
No
Stock ownership
Yes
N/ap
Yes
No
Other – Critical illness insurance
Yes
N/ap
No
No
Other – Accidental death and dismemberment insurance
Yes
N/ap
Yes
No
Includes a union covering 90 employees organized in Peru in October, but negotiations did not begin until 2017.
This information is not made available until June; therefore, we are a year behind in our public reporting.
Drop in ratio is due to the time period in 2016 when there was no VP of the Manitoba Business Unit.
Increase in ratio is due to the higher share price and the vesting of bonuses in 2016.
In Q4 2016, we adopted revised Board reporting criteria that reduced the number of incidents reported to the Board in order to better focus discussion.
Society
2016
2015
2014
2013
Total number of incidents of discrimination (and actions taken) (HR3)
111. This incident was filed in 2015 by a former employee alleging discrimination based on gender. The case is still ongoing.
0
0
0
Land use disputes (MM6)
3
0
3
2
Resettlements (MM9)
Number of households
0
36
0
0
Number of individuals
0
150
0
0
Employees trained in anti-corruption policies (SO4)
Number
66
360
182
336
Percentage of workforce
4%
21%
10%
21%
Percentage of Board and management given training
100%
91%
N/av
N/av
Employees that anti-corruption policies have been communicated to
Number – management22. Added to reflect G4 reporting guidelines. SO4 was not broken down into these subsections in reporting years prior to 2014; therefore, data for the previous year is not available (N/av).
534
229
412
N/av – See above
Percentage
100%
98%
0%
N/av – See above
Number – non-management
418
560
485
N/av – See above
Percentage
27%
100%
0%
N/av – See above
Governance body members that anti-corruption policies have been communicated to
Number
10
10
10
N/av
Percentage
100%
100%
100%
N/av
Governance body members that received training on anti-corruption
Number
10
10
10
N/av
Percentage
100%
100%
100%
N/av
Average hours of training (Peru and Arizona Business Units only) (LA9)
Hudbay security personnel trained in human rights policies and procedures
Number
14
15
15
N/av – Not previously reported
Percentage
100%
98%
100%
N/av – Not previously reported
Contractor security personnel trained in human rights policies and procedures
Number
7
175
158
N/av – Not previously reported
Percentage
100%
99%
92%
N/av – Not previously reported
Value of fines or sanctions for non-compliance with laws and regulations (SO8)
$0
$5,000
$3,352
$1,277
Grievances about impacts on society (SO11)
Number filed through formal grievance mechanisms
32
67
78
110
Number addressed during reporting period
32
67
78
110
Number resolved during reporting period
12
65
67
103
Number filed prior to the reporting period that were resolved during the reporting period
3
6
32
N/av
Number of other concerns
78
704
Environment (EN34)
1
4
N/av – See above
Labour and commercial practices (LA16)
24
54
N/av – See above
Resettlement/livelihood
1
2
N/av – See above
Human rights
1
1
N/av – See above
Other
4
6
N/av – See above
Closure plans (MM10)
Total number of operations
5
7
8
N/av
Number of company operations that have closure plans
8
10
10
6
Percentage of total operations that have closure plans
160%
125%
125%
100%
Number of advanced exploration projects that have closure plans
1
0
1
4
Percentage of advanced exploration projects that have closure plans
100%
N/ap
100%
100%
Overall financial provision representing the present value of future cash flows relating to estimated closure costs per Canadian generally accepted accounting principles (in $000s)
$177,296
$147,027
$185,395
$141,566
This incident was filed in 2015 by a former employee alleging discrimination based on gender. The case is still ongoing.
Added to reflect G4 reporting guidelines. SO4 was not broken down into these subsections in reporting years prior to 2014; therefore, data for the previous year is not available (N/av).
Environment
2016
2015
2014
2013
Direct energy consumption by primary energy source (terajoules) (EN3)
Heavy oil
0
0
0
0
Propane
579
629
700
580
Natural gas
0
0
0
0
Diesel
1,941
2,034
1,993
1,346
Light oil
0
0
4
6
Gasoline
14
11
12
11
Biofuel
0
0
0
0
Ethanol
0
0
0
0
Hydrogen
0
0
0
0
Other
0
1
0
0
Total
2,533
2,675
2,709
1,943
Indirect energy consumption by primary energy source (terajoules)
Total electricity consumed
5,263
4,932
3,322
3,048
Indirect energy sold/credits (terajoules)
Electricity
0.5
0.4
N/av
N/av
Total indirect energy consumed by organization (terajoules)
5,262
4,936
N/av
N/av
Energy intensity (terajoules per kilotonne of metal in concentrate)(EN5)
27.3
30.9
50.2
42.9
Total direct and indirect greenhouse gas emissions (kilotonnes of CO2-equivalent)
Direct carbon dioxide emissions (EN15)
170.96
188.08
182.28
133.26
Indirect carbon dioxide emissions (EN16)
322.31
277.80
6.91
4.84
Total
349.66
455.30
189.19
138.10
GHG intensity (EN18)
1.23
1.82
1.57
1.19
NOx, SOx and other significant air emissions (in kilotonnes) (EN21)
Sulphur dioxide emissions
0.0
0.0
0.0
0.0
Particulate
0.44
0.16
0.17
0.16
Total water withdrawal (000 cubic metres) (EN8)
Surface water
10,632
11,549
11,287
10,789
Ground water
3,531
2,698
930
441
Rainwater collected directly and stored by the organization
7,143
7,168
4,048
N/av
Waste water from another organization
0
0
N/av
N/av
Municipal water supplies
0
0
1
0.01
Total water withdrawal
21,306
21,415
16,266
11,230
Percentage and total volume of water recycled and reused (EN10)
Total volume (megalitres)
56,291.7411. Increase is due to an increase in the amount of water available for reuse.
16,944.37
N/av
N/av
Percentage
50.58%
7.91%
N/av
N/av
Total water discharged (000 cubic metres) (EN22)
To Flin Flon Creek/Ross Lake/Schist Lake
14,353
10,546
10,819
12,418
To Anderson Creek/Wekusko Lake
8,025
4,594
3,939
4,180
To Woosey Creek/Morgan Lake
2,142
1,106
1,184
1,123
Herblet Lake
926
N/ap
N/ap
N/ap
Town of Snow Lake Sewer
0
0
8
N/ap
To ground
247
217
187
35
To land (irrigation using treated water in Peru)
0
0
0
139
To Chilloroya River (Peru)
188
2,623
737
N/ap
Water treated (000 cubic metres)
25,911
19,086
19,887
19,867
Total number of significant spills (EN24)
922. Of these nine spills, eight were in Manitoba and one was in Peru. In Manitoba, there were three chemical spills, one oil spill, three waste spills, and one “other”. There were no major impacts to the environment from these spills. In Peru, the spill was sludge from the open pit mine, which contaminated a water body with sediment and sludge.
9
12
5
Volume (m3)
516.5
382.0
103.0
3.8
Hazardous waste disposed of at external facility (tonnes) (EN25)
1,520.3
1,508.5
658.5
522.3
Total waste (tonnes) (MM3)
Overburden
2,053,659.9
N/av
N/av
N/av
Waste rock
51,426,208.8
42,764,760.0
N/av
N/av
Tailings
28,968,944.0
24,780,081.6
N/av
N/av
Number of fines or sanctions for non-compliance with environmental laws and regulations (EN29)
0
0
0
0
Land use (hectares) – Mineral tenure (controlled) (MM1)
Percentage of sites with legally required plans in place
100%
100%
N/ap
N/ap
Number of sites with voluntary plans in place
1
1
1
2
Habitats protected or restored (hectares) (EN13)
Protected
0
0
0
0
Restored33. In Peru, we have a revegetation program. Revegetation was conducted using three types of native grass seeds. The 2015 revegetation program was monitored and we observed a recovery of original biodiversity, achieving landscape integration in 95% of the intervened area.
These areas are in the monitoring phase.
51.93
0.62
2
22.8
Partnerships exist44. In Peru, we are partnered with UB Constancia, Hudbay Property – Taludes del DM3.
Yes
Yes
N/av
N/av
Status at close of reporting period
Monitoring
Monitoring
N/av
N/av
IUCN Red List species and National Conservation List species (EN14)
Critically endangered
3
3
N/av
N/av
Endangered
8
8
N/av
N/av
Vulnerable
12
14
N/av
N/av
Near threatened
11
9
N/av
N/av
Least concern
6
6
N/av
N/av
Increase is due to an increase in the amount of water available for reuse.
Of these nine spills, eight were in Manitoba and one was in Peru. In Manitoba, there were three chemical spills, one oil spill, three waste spills, and one “other”. There were no major impacts to the environment from these spills. In Peru, the spill was sludge from the open pit mine, which contaminated a water body with sediment and sludge.
In Peru, we have a revegetation program. Revegetation was conducted using three types of native grass seeds. The 2015 revegetation program was monitored and we observed a recovery of original biodiversity, achieving landscape integration in 95% of the intervened area.
These areas are in the monitoring phase.
In Peru, we are partnered with UB Constancia, Hudbay Property – Taludes del DM3.
Dealing with the Inevitable: Managing Price Cyclicality
The ebb and flow of demand – and the rise and fall of prices – have always been part of mining. This means that Hudbay has been successfully managing price cycles in the metals markets for close to 90 years. That history, combined with the experience of our leadership team, provided useful perspective and insight throughout the low copper price environment of the last few years.
When Hudbay incorporated in 1927, our operations were based in Manitoba and our primary market was North America. Today, our company is international and our market is global. Over the last 10 years, demand for copper was largely driven by economic and industrial growth in China. In recent years, China’s economy has slowed, and growth in the world’s other major markets has also been largely muted.
At the same time, as a result of investment earlier in the decade, a number of new sources of copper – including our Constancia mine – came on stream and global production grew. As a natural consequence of increased supply and slower demand growth, the price for copper dropped, hitting a multi-year low in January 2016.
We responded to these events by focusing our efforts where we could make a difference – on improving efficiencies, strengthening our balance sheet and managing costs at all of our operations.
As Alan Hair, Hudbay’s President and Chief Executive Officer, observed at the Company’s year-end town hall staff meeting: “We began January with copper at a multi-year low price, and the upside of 2016 is how the organization responded. We delivered cost reductions at our operations, while still meeting guidance. We also restructured our credit facilities, positioning the Company for an even tougher pricing environment than turned out to be the case. Most importantly, we showed we could weather the storm while still moving forward.”
Toward the end of the year, the copper price improved, and our focus on cost control and generating cash flow from operations meant we were able to begin devoting resources to plans for growth and exploration. Unlike many in the copper sector, Hudbay had maintained core exploration teams. Our capacity to respond effectively to near-term challenges, while continuing to build and plan for the long term, is the key to delivering positive performance.
A Foundation for Rewarding Community Relationships
Mining is of tremendous importance to Peru. In 2015, it accounted for 17.6% of the country’s GDP and roughly half of its exports. Mining brings tax revenue, jobs, investment, infrastructure and other important benefits. Understandably, it can also prompt questions and concern from local communities.
In 2016, our Constancia mine saw a protest march, a roadblock and a brief occupation. For safety reasons, the occupation led to a temporary suspension of operations. The occupiers were from communities that had all signed co-operation and development agreements with Hudbay and with local and national governments. For various reasons, they were dissatisfied with the scope of the agreements and the pace of their implementation – and they voiced their concerns through protests such as these, which are commonly employed tactics in rural and outlying districts of Peru.
With forbearance and discipline from all sides, both legitimate protest and civil disobedience can be resolved peacefully, as were the three actions around Constancia. However, we know it doesn’t always happen this way in Peru and we work very hard to maintain good relationships with our neighbours and mitigate potential issues. We do so with the understanding that points of difference arise even in the best relationships. The key to maintaining those relationships is regular and open communication, and, on both sides, a willingness to consider other points of view.
Our Constancia operations have more than 17 people who focus on engaging with communities and supporting development. They keep our neighbours informed about what we’re doing, and why, while making sure we understand and acknowledge their concerns. They also work with local communities on projects to improve infrastructure, upgrade health facilities and build capacity for sustainable economic development and growth.
Managing Our Impact and Supporting Biodiversity
Nothing better defines the nature of modern mining than the commitment to operating in accordance with the principles of environmental responsibility and sustainability. An example of this commitment can be seen every day in the hands-on, practical steps Hudbay takes to foster biodiversity.
In many cases, our steps are framed out in protocols established by organizations like the Mining Association of Canada (MAC), the International Standards Organization (ISO) and the International Finance Corporation (IFC). While the guidelines and standards set by these outside organizations play a key part in helping us be a responsible operator, the drive to meet them comes from inside our organization.
People who don’t know the industry might be surprised to discover the extensive effort companies and employees make to ensure our activities are compatible with surrounding ecosystems. In addition to miners and engineers, we employ and partner with biologists, botanists, ecologists and environmental scientists. They understand industry’s part in society’s overall impact on the environment, but they also recognize that sustainable mining can contribute to enhancing the quality of life around the world and they are dedicated to making sure that Hudbay meets high standards for environmental performance.
In our approach to conserving biodiversity, we’re guided by the “mitigation hierarchy”, a series of defined steps, taken throughout the life of a project, that help limit the adverse impacts of a development on biodiversity, and can potentially lead to a net gain. Here are a few examples:
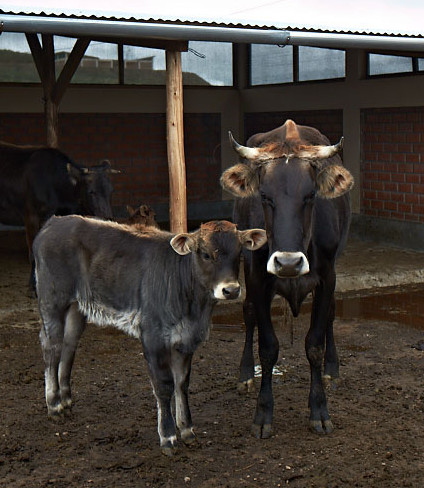
In Peru, we’re gathering, breeding, relocating and releasing two threatened animal species, an aquatic frog in conservation status and an endemic reptile from the region to similar habitats outside of the mine site. We’re also working with members of local communities near our operations to preserve and restore wetlands, including helping area ranchers identify practical alternatives when it comes to finding places for feeding and watering their cattle.
In Manitoba, we have an ongoing partnership with Manitoba Sustainable Development (formerly Manitoba Conservation) to help ensure that the local caribou populations are not adversely impacted by our operations. We consulted with Manitoba Sustainable Development during the planning stages of our Reed and Lalor mines to make our activities as caribou-friendly as possible, and we continue to provide financial and practical support to help them monitor caribou populations.
In Arizona, we will be funding a variety of mitigation measures including aquatic and bird species conservation activities, salvaging and replanting agave plants that are a food source for an endangered bat, avoiding specific sites to prevent plant species impacts, implementing jaguar and ocelot monitoring programs, as well as providing financial support to the Forest Service to hire a biologist for the term of conservation to manage funds and monitor results.
Biodiversity conservation is integral to modern mining, and one of the cornerstones of our approach to building a business that is sustainable and successful.
Human Rights Primer for Mining Personnel
Hudbay was a significant supporter of a human rights video developed by the Canadian Centre for Excellence in Corporate Social Responsibility for the Extractive Sector. The video introduces mining employees to the Universal Declaration of Human Rights and what they and their companies should do to respect and protect human rights. Produced with support from Global Affairs Canada, Natural Resources Canada and the Mining Association of Canada and its members, the video is publicly available on YouTube.
Post-Verification Review Drives Improvement
As a member of the Mining Association of Canada (MAC), Hudbay participates in the Towards Sustainable Mining (TSM) initiative, which requires mining companies to annually assess their facilities’ performance across six important areas:
Tailings management
Aboriginal and community outreach
Safety and health
Biodiversity conservation
Crisis management
Energy use and greenhouse gas emissions management
The results are freely available to the public and externally verified every three years.
Every year, two or three companies that have recently undergone external verification are asked to participate in a Post-Verification Review (PVR). Led by a multi-stakeholder Community of Interest (COI) Advisory Panel, the PVR helps the panel analyze activities that contribute to TSM results and promote continuous improvement in the environmental and social practices of the mining industry. We were pleased to participate in a PVR in 2016 as a way of improving our own performance and helping raise industry standards.
As part of the PVR, we submitted background information about Hudbay’s sustainability and TSM performance, presented to the COI Advisory Panel via webinar and then participated in a face-to-face dialogue in Ottawa. The Panel’s summary of findings are published on the MAC website.
Safety Accountability Starts at the Top
Recognizing the importance of leadership in creating a positive safety culture, we introduced a company-wide Visible Felt Leadership (VFL) program for all levels of management including the CEO. VFL guides leaders to conduct regular safety-focused workplace visits and to engage constructively with employees at all levels of operations. It’s a way of demonstrating to employees the importance we place on their safety and well-being, and to engage positively around safety issues.
As part of the corporate VFL procedure, senior leaders complete a form each time they conduct a workplace visit. They document who they talked with and all safe acts and at-risk behaviours or conditions they observed. They also establish responsibilities and timelines for follow-up on safety concerns. Each business unit has implemented its own VFL procedure tailored to its workplace and used by its business unit leaders.
“Employee conversations are an essential part of the program,” says Ian Cooper, Manager, Health and Safety. “They provide an opportunity for employees and leaders to have meaningful one-on-one or small group discussions about safety performance and concerns in their workplace, which leads to a greater sense of personal accountability for safe work practices and ultimately to better results.”
Building Leaders from Within
Over the next three years, we’ll be rolling out a global leadership initiative aimed at building sustainable leadership bench strength throughout Hudbay. An important part of it will be training courses offered at introductory, intermediate and advanced levels. Introductory level courses will be held locally, while intermediate courses will bring people from different business units together at rotating locations, and advanced courses will be customized to individual needs.
As a starting point, we created a leadership model with business input that articulates what we consider to be Hudbay’s core leadership competencies. The competencies fall into three main categories: growing people, growing the Company and growing oneself.
According to Amanda Abballe, Human Resources Manager: “Growing people is important because experienced and talented people are the basis for our company’s success and we are responsible for developing a skilled workforce. Growing Hudbay is important for being an adaptable and focused organization positioned to succeed in an ever-changing environment. Growing oneself builds confidence in one’s abilities and a desire to continuously improve, which are building blocks for personal success.”
Course content will be finalized in 2017 and we expect to begin delivering the program to the first cohort before year-end.
Benchmarking Hudbay’s Efforts in Aboriginal Inclusion
Hudbay achieved a Bronze level standing in the Progressive Aboriginal Relations (PAR) program of the Canadian Council for Aboriginal Business (CCAB) in 2016. The PAR program supports improvement in corporate performance in Aboriginal relations in Canada through benchmarking against a broad set of criteria in the areas of employment, business development, community investment, community engagement and company strategy. The certification process confirms performance through an extensive questionnaire that is assessed by an independent third-party verifier who reviews the responses and meets with Aboriginal stakeholders and company personnel to validate the responses. Final determination at the Bronze, Silver or Gold level is by a jury comprised of Aboriginal business people.
In each of the past three years, Hudbay completed the PAR questionnaire for our Canadian operations, and each year the verifier’s report provided guidance to improve our program. In 2016, the report was then reviewed by a jury of Aboriginal business leaders who determined that Hudbay met the requirements for Bronze level in the PAR program.
Thirty-one of the 123 CCAB member companies are PAR certified, and six of these companies are at the Bronze level. For Hudbay, achieving Bronze level represents important progress in our efforts to include Aboriginal communities in our business. “It’s important to us as a company that we deliver on this commitment with Aboriginal communities. This achievement shows that we’re on the right track,” said Pam Marsden, Aboriginal Liaison Officer, Manitoba Business Unit.
From Peru to Ontario – An Organic Opportunity
As part of our development-focused relationship with the regional government, Hudbay Peru sponsored the construction of a modern dairy plant in the Chumbivilcas region. The Cullahuata dairy currently processes 4,000 litres of milk per day and expects to increase production to 12,000 litres in the near future. It also produces several varieties of cheese, yogurt and butter.
The long-term goal is to establish a “dairy corridor” in the region. In 2016, Harmony Organic dairy in Kincardine, Ontario, stepped up to help, establishing a mentoring relationship with the Cullahuata dairy. Harmony Organic came to know the dairy through one of the Global Indigenous Development Trust trips that Hudbay had sponsored.
Harmony Organic’s CEO visited the Cullahuata dairy and is helping it become certified as organic. As part of that effort, two farmers from Chumbivilcas were invited to Kincardine to work at Harmony for a term and learn by doing. Two more will go in 2017. The knowledge they bring back – about farming, animal management and dairy operation – will be important in establishing the region’s first certified organic dairy.
In August 2016, at the third annual Community Relations International Conference in Peru, Hudbay was honoured to receive a community relations award for its work in the construction and management of the Cullahuata dairy plant.
Awarded for Reclamation
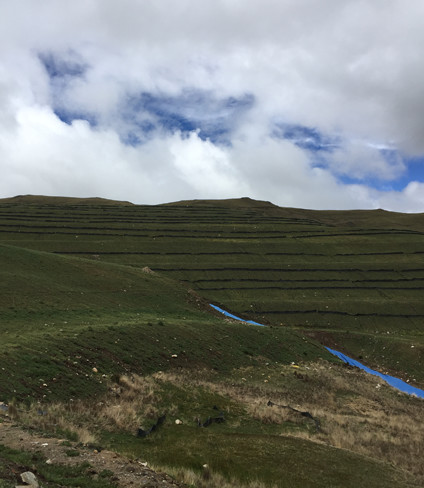
Hudbay Peru received an SNMPE (National Society of Mining, Petroleum and Energy) Sustainable Development Award in the environmental management category for its progressive reclamation practices.
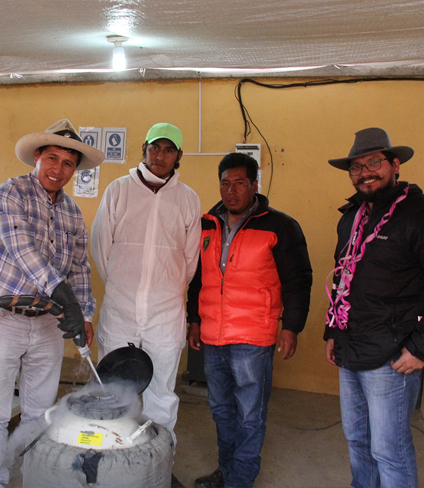
In keeping with environmental best practices, we try to return land to its original state as soon as it’s no longer required as part of production. At Constancia, we implemented a program that paid community members for collecting native grass seed for reclamation purposes and helping plant the seeds and erect erosion control structures.
The response to the program by the local communities of Chilloroya, Uchucarco, Casa Blanca, Collana Alta and Huaylla Huaylla was overwhelmingly positive, with 2.2 tonnes of native seeds collected, and over 26 hectares of land revegetated in less than a year.
Six community members work with us on an ongoing basis, managing our tree nursery and doing reclamation work. We’re planning to conduct a larger-scale forestation program in 2017 and will hire additional workers for that.
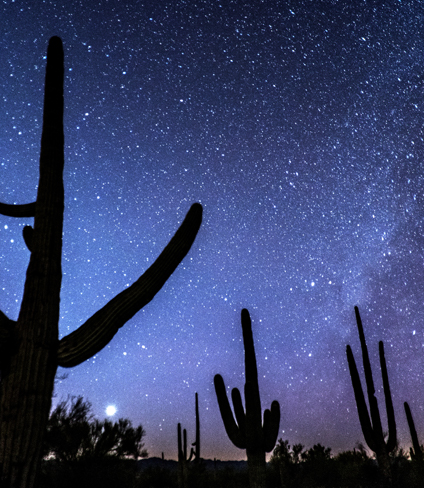
Maintaining Dark Skies
Maintaining dark skies is important to scientific astronomy in Arizona, but must be aligned with the need to meet employee safety requirements of the Mine Safety and Health Administration (MSHA). To achieve both goals, the Rosemont project will implement a groundbreaking, technologically advanced lighting system.
We updated our lighting plan in 2016 in consultation with an International Dark Sky Association board member. Features include the use of filtered LED fixtures, colour rendering to avoid blue-spectrum lights (which are among the most harmful to dark skies), and shielding/beam control on non-fixed lights to reduce direct uplight. All of these measures will minimize the effects artificial lighting can have on the night sky. In addition, we plan to implement a variety of dust control measures that will aid in reducing potential light dispersion.
The impact of these new measures will be significant – reducing output from 21,815,355 lumens in the original engineering plans to 6,529,184 lumens.
Our other commitments include annual funding to the Smithsonian Institution at the Whipple Observatory to measure light and light effects and implement additional ground-based monitoring sites. During operations, light emissions will continue to be monitored by STEM Labs, a non-profit organization dedicated to understanding the effects of maintaining dark skies for astronomy and environmental impacts.
Once Rosemont’s permits are received, a Sky Brightness Monitoring Plan Oversight Committee will be created to monitor all pertinent data from the operations. Should any impacts exceed expectations, the Committee will make recommendations for corrective action. The committee will be comprised of experts from the astronomy community and the lighting industry and representatives from both the Forest Service and Rosemont.
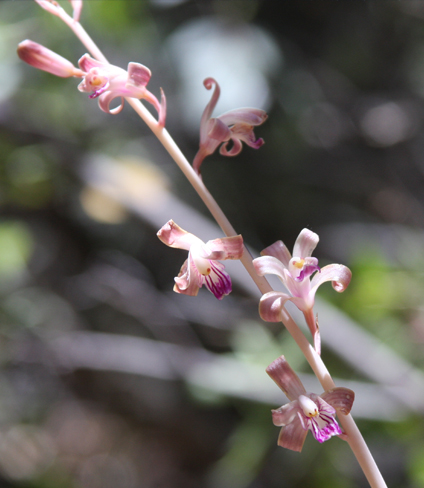
Studies in Orchids
We’ve done a lot in the interest of the Coleman’s coralroot (Hexalectris colmaneii), a rare orchid found growing in southwestern New Mexico and southern Arizona, in part near the site of the proposed Rosemont mine.
Rosemont is contributing to the science and understanding of the plant.
Extensive surveys conducted by Rosemont have expanded the known distribution of the species to over 15 locations in seven distinct mountain ranges in southeastern Arizona.
Originally the Coleman’s coralroot orchid was thought to have a very specialized habitat, occurring only in the bottoms of shaded canyons with dense oaks and then only in a few canyons in three mountain ranges in southeastern Arizona.
Rosemont has redesigned the mine plant site to avoid one location where large numbers of Coleman’s coralroot spikes have consistently been observed. The area will be fenced to limit potential impacts from disturbance. The dry stack tailings position has also been realigned to avoid a second population known to occur in the vicinity of the project. Consequently, the project will directly impact small numbers of Coleman’s coralroot.
Overall, our surveys since 2010 have greatly increased the understanding of the habitat, range and relative abundance of orchid spikes known to exist. These surveys have also greatly expanded understanding of what is habitat for Coleman’s coralroot by documenting the orchid in areas that are strikingly different from the large drainages originally thought to be a requirement for the species. Surveys commissioned by Rosemont have also documented several locations of a similar species, Hexalectris arizonica, that had not been known previously, as well as a species of orchid, Hexalectris parviflora, that was not previously known to occur in the US.
Rosemont continues to survey areas in the vicinity of the Rosemont Copper Project to document the persistence of known locations of Hexalectris species and search for additional locations. Rosemont has also continued to monitor three locations where large numbers of orchid spikes are consistently found in order to provide long-term data to look for trends in orchid numbers and correlations with climate and habitat variables.