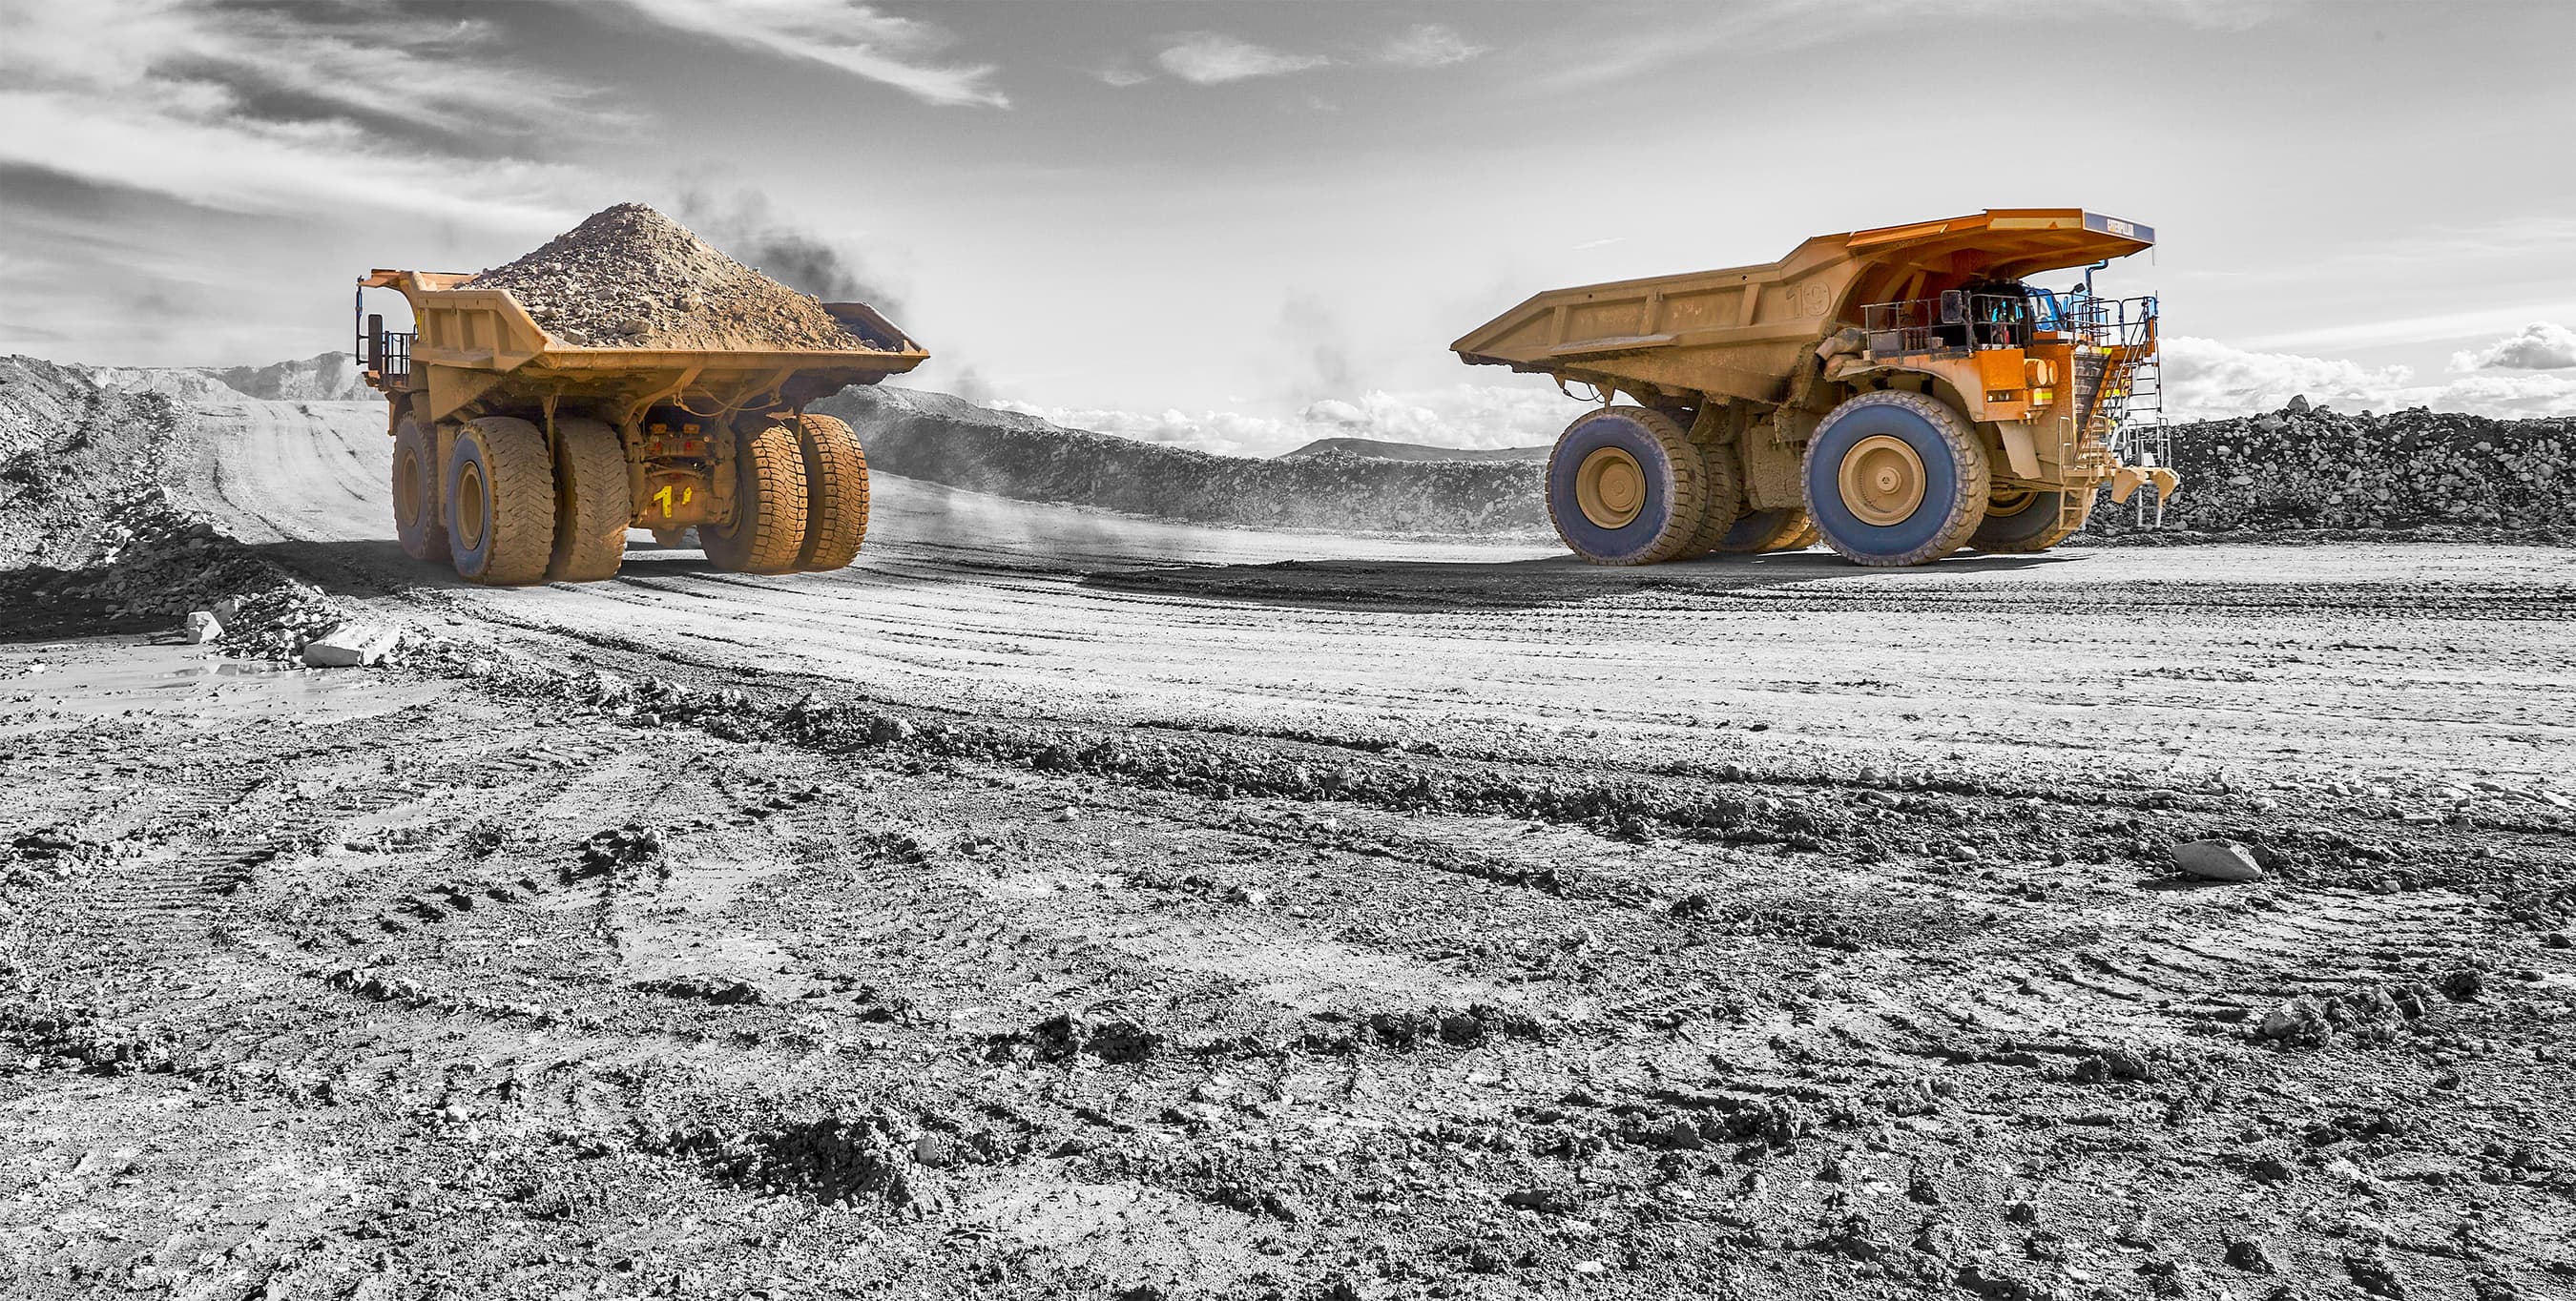
Over the year, Hudbay demonstrated our commitment to delivering strong performance, to operating with fiscal discipline, to generating free cash flows, to fostering a strong safety culture and to maintaining close, mutually rewarding relationships with our local communities.

2022 Financial Performance
In 2022, Hudbay built on the foundation we established with the successful completion of approximately $250 million in brownfield investments, including projects such as Pampacancha and New Britannia. Additionally, we confirmed that we have an exceptional organic growth pipeline through surface rights agreements in Peru, technical improvements and targeted exploration in Manitoba, and the completion of a highly encouraging PEA for Copper World.
Financial Highlights
Full-year consolidated cash cost and sustaining cash cost per pound of copper produced, net of byproduct credits, were $0.86 and $2.07, respectively, and similar to 2021 levels, despite inflationary cost pressures that were offset by higher copper production and higher byproduct credits.
Repaid approximately 50% of the original gold prepayment liability secured for funding the New Britannia mill refurbishment, and remain focused on reducing net debt throughout 2023.
On track to deliver consecutive years of production growth in 2023 and 2024.
Positioned for the best free cash growth in the sector.
|
Financial Summary
For the years ended December 31
|
||
|---|---|---|
| Financial Performance (in $000s, except per share and cash cost amounts) | Dec. 31, 2022 | Dec. 31, 2021 |
| Revenue | $1,461,440 | $1,501,998 |
| Profit (loss) before tax1 | 95,815 | (202,751) |
| Basic and diluted earnings (loss) per share1 | 0.27 | (0.93) |
| Profit (loss) | 70,382 | (244,358) |
| Operating cash flows before changes in non-cash working capital | 391.7 | 483.9 |
| Financial Condition (in $000s) | Dec. 31, 2022 | Dec. 31, 2021 |
| Cash | $225,655 | $270,989 |
| Working capital2 | 76,534 | 147,512 |
| Total assets | 4,325,943 | 4,616,231 |
| Total long-term debt | 1,184,162 | 1,180,274 |
| Equity | 1,571,809 | 1,476,828 |
|
Operations Summary
For the years ended December 31
|
||
| Consolidated Production (contained metal in concentrate and doré)3 | 2022 | 2021 |
| Copper (tonnes) | 104,173 | 99,470 |
| Gold (ounces) | 219,700 | 193,783 |
| Silver (ounces) | 3,161,294 | 3,045,481 |
| Zinc (tonnes) | 55,381 | 93,529 |
| Molybdenum (tonnes) | 1,377 | 1,146 |
| Consolidated Metal Sold (payable in metal in concentrate and doré)3 | 2022 | 2021 |
| Copper (tonnes) | 94,473 | 92,200 |
| Gold4 (ounces) | 213,415 | 168,358 |
| Silver4 (ounces) | 2,978,485 | 2,427,508 |
| Zinc5 (tonnes) | 59,043 | 96,435 |
| Molybdenum (tonnes) | 1,352 | 1,098 |
| Consolidated Costs (cash cost per pound of copper produced, net of byproduct credits (in $/lb)) | 2022 | 2021 |
| Cash cost | 0.86 | 0.74 |
| Sustaining cash cost | 2.07 | 2.07 |
| All-in sustaining cash cost | 2.26 | 2.30 |
|
1 Net loss for 2021 was negatively impacted by an impairment charge of $193.5 million related to an updated closure plan for our Flin Flon operations. We aim to update our closure plan every five years, and this increase largely reflects higher long-term water treatment costs in Flin Flon. We are committed to our closure plans and to satisfying our obligations. 2 Working capital is determined as total current assets less total current liabilities, as defined under International Financial Reporting Standards (IFRS) and disclosed on the consolidated financial statements. 3 Metal reported in concentrate and doré are prior to refining losses or deductions associated with smelter contract terms. 4 Includes total payable gold and silver in concentrate and in doré sold. 5 Includes refined zinc metal sold and payable zinc in concentrate sold. |
||